Use app×
Join Bloom Tuition
One on One Online Tuition
JEE MAIN 2025 Foundation Course
NEET 2025 Foundation Course
CLASS 12 FOUNDATION COURSE
CLASS 10 FOUNDATION COURSE
CLASS 9 FOUNDATION COURSE
CLASS 8 FOUNDATION COURSE
0 votes
1.4k views
in Mathematics by (130k points)
Solve the following system of inequalities graphically: x + y ≤ 9, y > x, x ≥ 0

1 Answer

0 votes
by (93.8k points)
selected by
 
Best answer

X + y ≤ 9 …………………….. (1)
y > x …………………... (2)
x ≥ 0 …………………... (3)

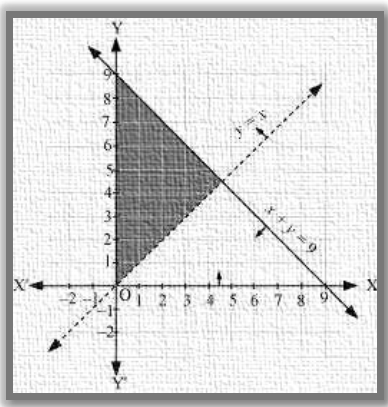
The graph of the lines, x + y= 9 and y = x, are drawn in the figure below.

Inequality (1) represents the region below the line, x + y = 9 (including the line x + y = 9). It is observed that (0, 1) satisfies the inequality, y > x. [1 > 0] Therefore, inequality (2) represents the half plane corresponding to the line, y = x, containing the point (0, 1) [excluding the line y = x]. Inequality (3) represents the region on the right hand side of the line, x = 0 or y-axis (including y-axis).

Hence, the solution of the given system of linear inequalities is represented by the common shaded region including the points on the lines, x + y = 9 and x = 0, and excluding\ the points on line y = x as follows.

Welcome to Sarthaks eConnect: A unique platform where students can interact with teachers/experts/students to get solutions to their queries. Students (upto class 10+2) preparing for All Government Exams, CBSE Board Exam, ICSE Board Exam, State Board Exam, JEE (Mains+Advance) and NEET can ask questions from any subject and get quick answers by subject teachers/ experts/mentors/students.

Categories

...