Use app×
Join Bloom Tuition
One on One Online Tuition
JEE MAIN 2025 Foundation Course
NEET 2025 Foundation Course
CLASS 12 FOUNDATION COURSE
CLASS 10 FOUNDATION COURSE
CLASS 9 FOUNDATION COURSE
CLASS 8 FOUNDATION COURSE
0 votes
185 views
in Statistics by (71.9k points)
closed by
The distribution of heights (in cm) of 96 children is given below
image
Draw a less type cumulative frequencies curve fo this data and use it to compute meidan height of the children.

1 Answer

0 votes
by (72.1k points)
selected by
 
Best answer
image
To draw the less than type ogive, we get the points (124,0),(128,5),(132,13),(136,30),(140,54),(144,70),(148,82),(152,88),(156,92),(160,95),(164,96) and join all these points by free hand
image
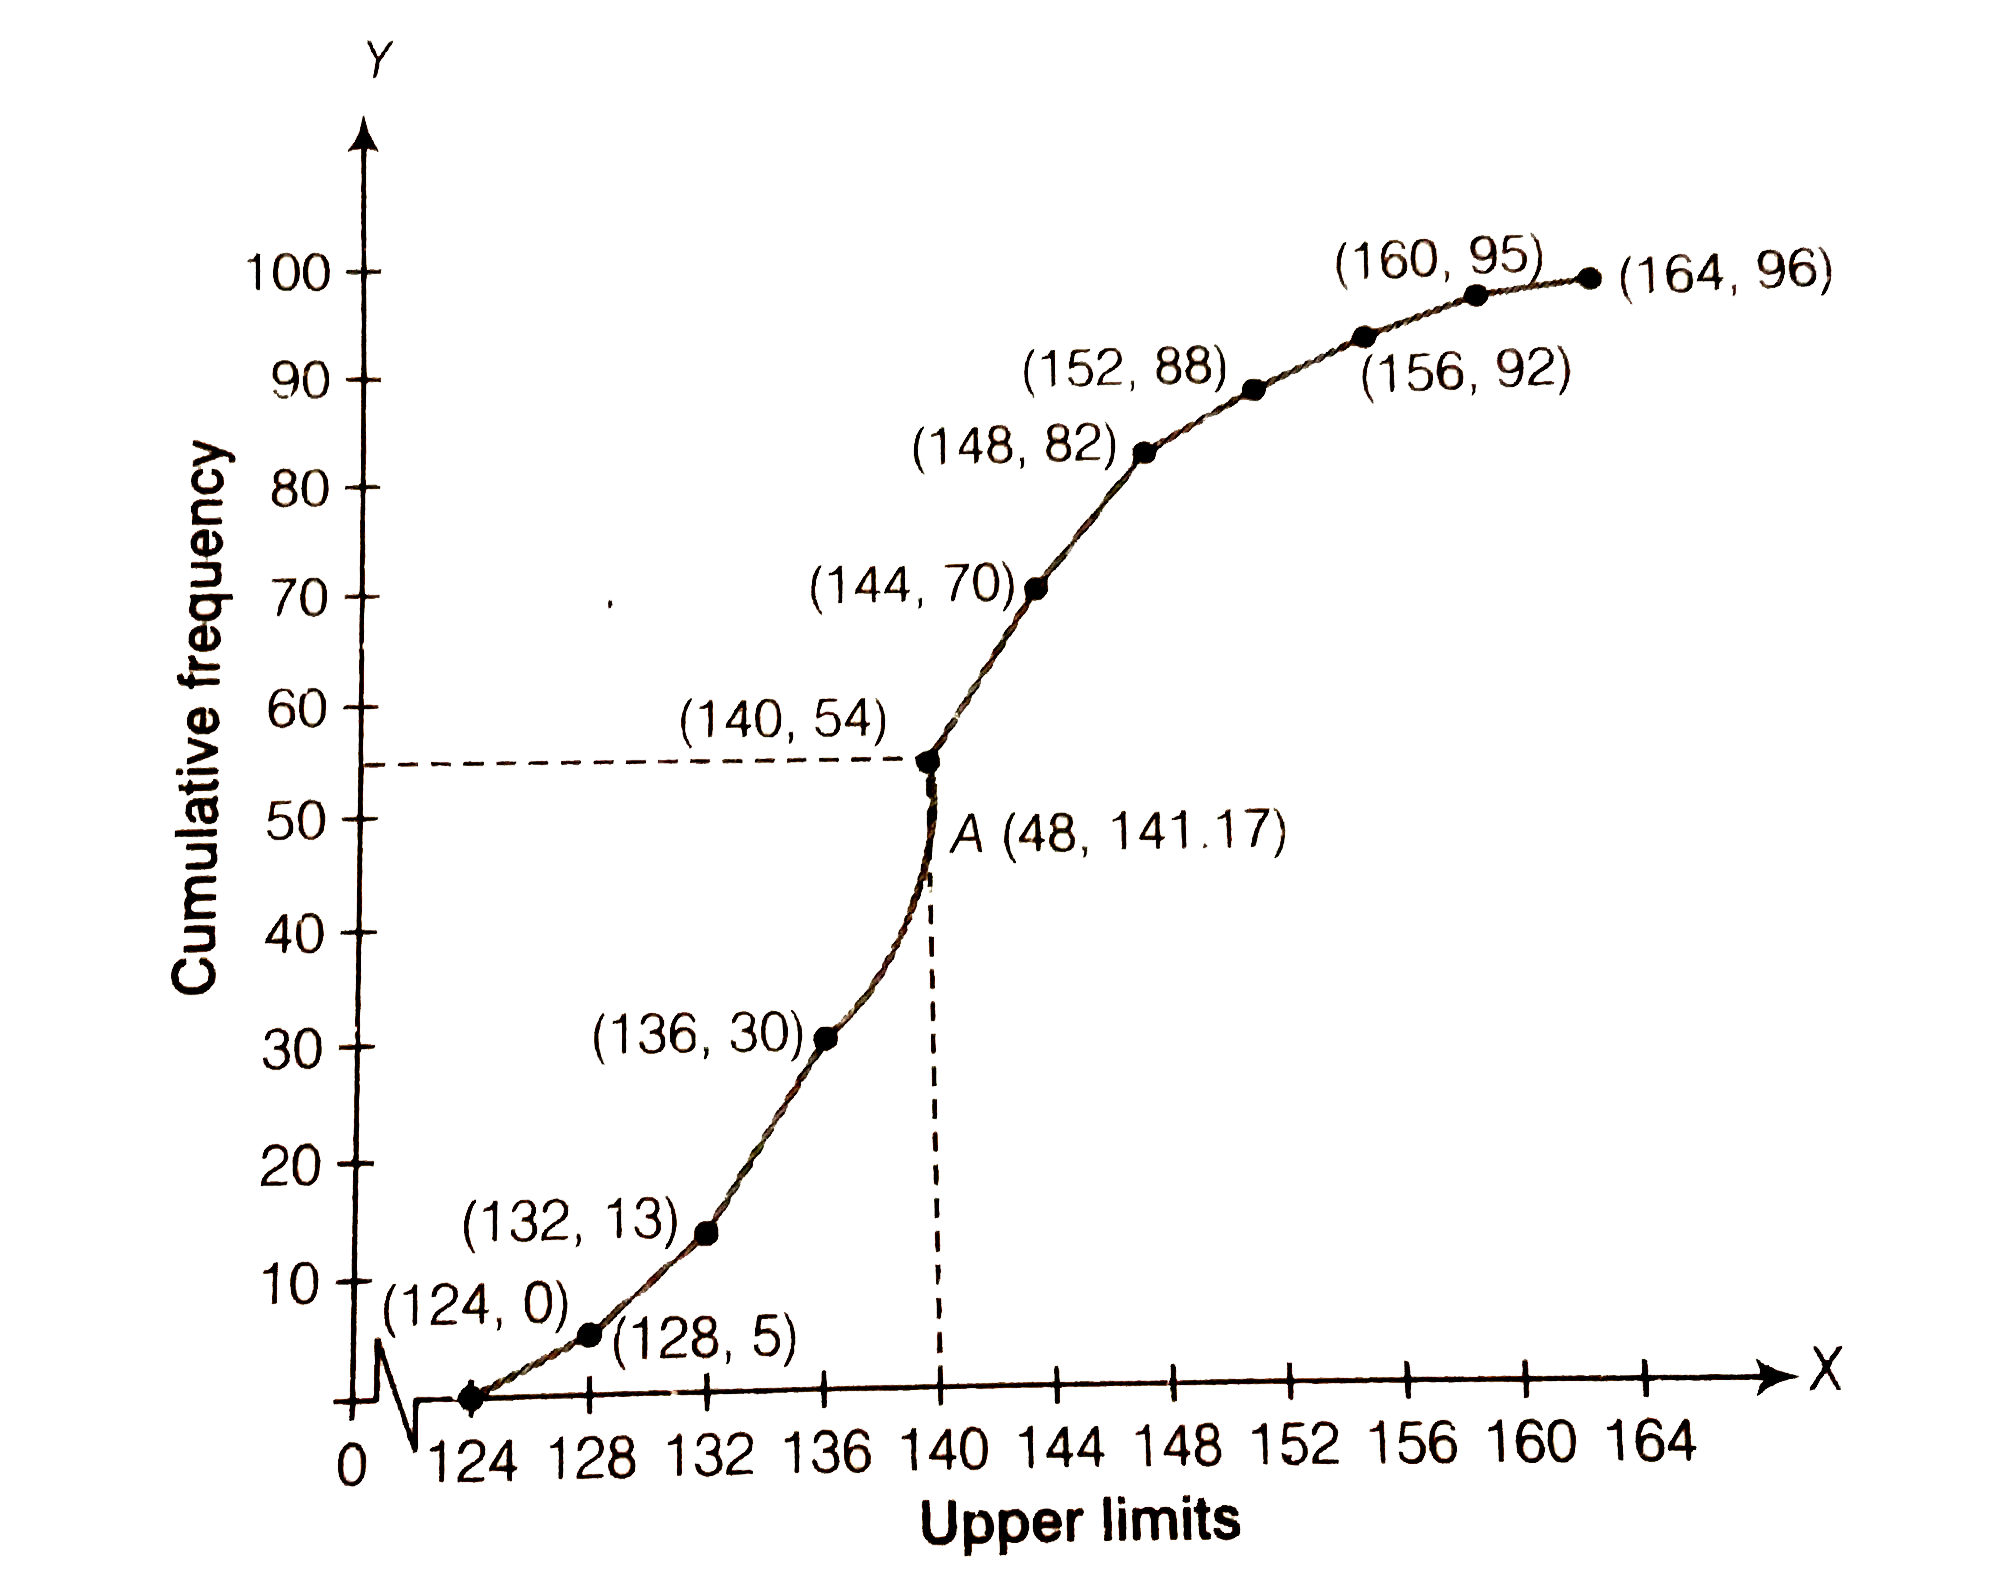
Here, `(N)/(2)=(96)/(2)=48`
We take, y=48 in y-cordination and draw a line parallel to X-axis meets the curve at A a draw a perpendicular line from point A to the X-axis and this line meets the X-axis at the point which is the median i.e. median=141.17

Welcome to Sarthaks eConnect: A unique platform where students can interact with teachers/experts/students to get solutions to their queries. Students (upto class 10+2) preparing for All Government Exams, CBSE Board Exam, ICSE Board Exam, State Board Exam, JEE (Mains+Advance) and NEET can ask questions from any subject and get quick answers by subject teachers/ experts/mentors/students.

Categories

...