Use app×
Join Bloom Tuition
One on One Online Tuition
JEE MAIN 2025 Foundation Course
NEET 2025 Foundation Course
CLASS 12 FOUNDATION COURSE
CLASS 10 FOUNDATION COURSE
CLASS 9 FOUNDATION COURSE
CLASS 8 FOUNDATION COURSE
0 votes
158 views
in Economics by (73.6k points)
closed by

The following frequency distribution gives the amount of annual depreciation (in lakh ₹) of 38 companies. Using this information, find skewness and its coefficient by Karl Pearson’s method. State the type of skewness.

Amount of annual depreciation (lakh ₹) 7 9 10 11 - 20 21 - 24 25 - 36
No. of companies 2 3 4 7 12 10

1 Answer

+1 vote
by (70.4k points)
selected by
 
Best answer

The frequency distribution of the given data is combined type. Therefore mode is not defined.

Hence, using Sk = 3 (x – M) and we calculate skewness and coefficient the formula j = 3(x¯−M)s of skewness.

Mean:

x̄ = \(\frac{Σfx}{n}=\frac{764.5}{38}\)

= ₹ 20.12 lakh

Median:

M class = class that Includes (n2)th observation

= class that includes (382)th observation

= class that includes 19th observation

Referring to column cf.

M class = 21 – 24

In exclusive form. M class = 20.5 – 24.5
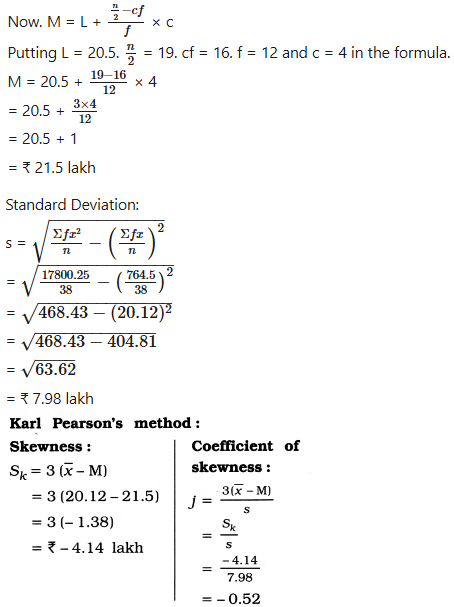
Type of skewness:

Sk = – 4.14. Therefore, the given frequency distribution Is negatively skewed.

Welcome to Sarthaks eConnect: A unique platform where students can interact with teachers/experts/students to get solutions to their queries. Students (upto class 10+2) preparing for All Government Exams, CBSE Board Exam, ICSE Board Exam, State Board Exam, JEE (Mains+Advance) and NEET can ask questions from any subject and get quick answers by subject teachers/ experts/mentors/students.

Categories

...