Use app×
Join Bloom Tuition
One on One Online Tuition
JEE MAIN 2025 Foundation Course
NEET 2025 Foundation Course
CLASS 12 FOUNDATION COURSE
CLASS 10 FOUNDATION COURSE
CLASS 9 FOUNDATION COURSE
CLASS 8 FOUNDATION COURSE
+1 vote
664 views
in Sets, Relations and Functions by (7.5k points)
closed by

NCERT Solutions Class 8 Maths Chapter 5 Data Handling here is made by experts in the field. Our experts have prepared these solutions in very simple language to make it easy for students to learn and comprehend. These solutions are precise and it is according to the latest syllabus provided by the CBSE. Our NCERT solutions are the best way to assist students in their CBSE exam preparation as well as for competitive exams like JEE Mains, JEE Advance, or any other similar exams. These solutions are explained in the step-wise method.

You can find Class 8 Maths Chapter 5 Data Handling here to help you understand the fundamental concepts. It will keep you interested and useful in solving a variety of problems. Revision Notes for Class 8 Maths are created by Sarthaks experts who have extensive knowledge of the subject. It will undoubtedly improve your performance and enable you to achieve high grades. If you want to clear your doubts and boost your confidence, NCERT Solutions for Class 8 Maths is essential.

Our NCERT Solutions Class 8 is all you need for your overall preparation for all the topics needed. Important topics mentioned here are: 

  • Pictograph
  • Construction of grouped frequency distribution table
  • Histogram
  • Pie chart
  • Steps of construction
  • Interpretation of a pie chart
  • Terms related to probability

NCERT Solutions Class 8 Maths provided by Sarthaks is one the great way to learn about all the topics related to Data Handling. All the topics are explained in the step-wise method. As suggested by our mentors it is the best way to learn, solve, revise, complete homework, making assignments.

2 Answers

+1 vote
by (7.5k points)
selected by
 
Best answer

NCERT Solutions Class 8 Maths Chapter 5 Data Handling

1. For which of these would you use a histogram to show the data?

(a) The number of letters for different areas in a postman’s bag.

(b) The height of competitors in an athletics meet.

(c) The number cassettes produced by 5 companies.

(d) The number of passengers boarding trains from 7.00 a.m. to 7.00 p.m. at a station. Give reason for each.

Solution:

(a) The number of areas cannot be represented in class-intervals. So, we cannot use the histogram to show the data.

(b) Height of competitors can be divided into intervals. So, we can use histogram here.

For example:

(c) Companies cannot be divided into intervals. So, we cannot use histogram here.

(d) Time for boarding the train can be divided into intervals. So, we can use histogram here.

For example:

2. The shoppers who come to a departmental store are marked as: man (M), woman (W), boy (B) or girl (G). The following list gives the shoppers who came during the first hour in the morning.

W W W G B W W M G G M M W W W W G B M W B G G M W W M M W W W M W B W G M W W W W G W M M W M W G W M G W M M B G G W.

Make a frequency distribution table using tally marks. Draw a bar graph to illustrate it.

Solution:

3. The weekly wages (in ₹) of 30 workers in a factory are:

830, 835, 890, 810, 835, 836, 869, 845, 898, 890,
820, 860, 832, 833, 855, 845, 804, 808, 812, 840,
885, 835, 835, 836, 878, 840, 868, 890, 806, 840

Using tally marks make a frequency table with intervals as 800-810, 810-820 and so on.

Solution:

4. Draw a histogram for the frequency table made for the data in Question 3, and answer the following questions:

(i) Which group has the maximum number of workers?

(ii) How many workers earn ₹ 850 and more?

(iii) How many workers earn less than ₹ 850?

Solution:

Refer to the frequency table of Question No. 3.

(i) Group 830-840 has the maximum number of workers, i.e., 9.

(ii) 10 workers earn equal and more than ₹ 850.

(iii) 20 workers earn less than ₹ 850.

5. The number of hours for which students of a particular class watched television during holidays is shown through the given graph.

Answer the following questions.

(i) For how many hours did the maximum number of students watch TV?

(ii) How many students watched TV for less than 4 hours?

(iii) How many students spent more than 5 hours watching TV?

Solution:

(i) 32 is the maximum number of students who watched TV for 4 to 5 hours.

(ii) 4 + 8 + 22 = 34 students watched TV for less than 4 hours.

(iii) 8 + 6 = 14 students watched TV for more than 5 hours.

6. A survey was made to find the type of music that a certain group of young people liked in a city.

Adjoining pie chart shows the findings of this survey. From this pie chart, answer the following:

(i) If 20 people liked classical music, how many young people were surveyed?

(ii) Which type of music is liked by the maximum number of people?

(iii) If a cassette company were to make 1000 CD’s, how many of each type would they make?

Solution:

(i) Number of young people who were surveyed = \(\frac{100\times 20}{10}\) = 200 people.

(ii) Light music is liked by the maximum people, i.e., 40%

(iii) Total number of CD = 1000

Number of viewers who like classical music = \(\frac{10\times 1000}{100}\) = 100

Number of viewer who like semi-classical music = \(\frac{20\times 1000}{100}\) = 200

Number of viewers who like light music = \(\frac{40\times 1000}{100}\) = 400

Number of viewers who like folk music = \(\frac{30\times 1000}{100}\) = 300

7. A group of 360 people were asked to vote for their favourite season from the three seasons rainy, winter and summer.

(i) Which season got the most votes?

(ii) Find the central angle of each sector.

(iii) Draw a pie chart to show this information.

Solution:

(i) Winter season got the most votes, i.e. 150

(ii)

(iii) Pie chart

+1 vote
by (7.5k points)

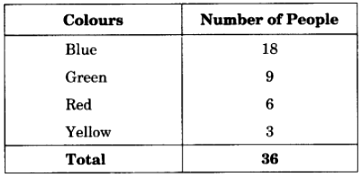
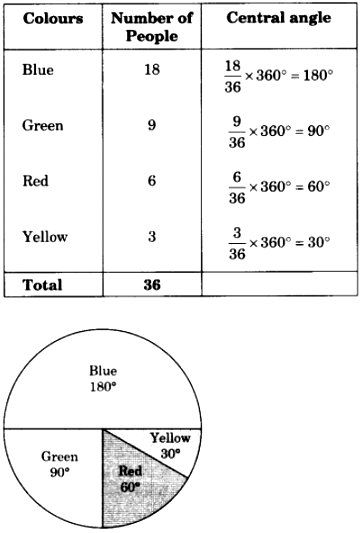
8. Draw a pie chart showing the following information. The table shows the colours preferred by a group of people.

Solution:

Table to find the central angle of each sector

9. The following pie chart gives the marks scored in an examination by a student in Hindi, English, Mathematics, Social Science and Science. If the total marks obtained by the students were 540, answer the following questions.

(i) In which subject did the student score 105 marks?

(Hint: for 540 marks, the central angle = 360°. So, for 105 marks, what is the central angle?)

(ii) How many more marks were obtained by the student in Mathematics than in Hindi?

(iii) Examine whether the sum of the marks obtained in Social Science and Mathematics is more than that in Science and Hindi.

(Hint: Just study the central angles).

Solution:

(i) For 540 marks, the central angle = 360°

For 105 marks the central angle = \(\frac{360}{540}\times 105\) = 70°

Corresponding subject = Hindi

(ii) Marks obtained in Mathematics = \(\frac{90}{360}\times 540\) = 135

Marks obtained in Mathematics more than Hindi = 135 – 105 = 30

(iii) Central angle of Social Science + Mathematics = 65° + 90° = 155°

Central angle of Science + Hindi = 80° + 70° = 150°

Marks obtained in Social Science and Mathematics are more than that of the marks obtained in Science and Hindi.

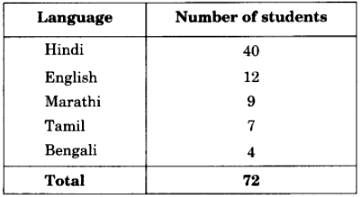
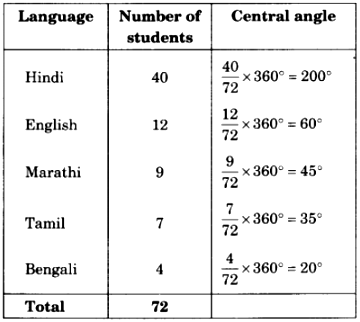
10. The number of students in a hostel, speaking different languages is given below. Display the data in a pie chart.

Solution:

11. List the outcomes you can see in these experiments.

(a) Spinning a wheel

(b) Tossing two coins together

Solution:

(a) There are four letters A, B, C and D in a spinning wheel. So there are 4 outcomes.

(b) When two coins are tossed together. There are four possible outcomes HH, HT, TH, TT.

12. When a die is thrown, list the outcomes of an event of getting

(i) (a) a prime number (b) not a prime number.

(ii) (a) a number greater than 5 (b) a number not greater than 5.

Solution:

(i) (a) Outcomes of event of getting a prime number are 2, 3 and 5.

(b) Outcomes of event of not getting a prime number are 1, 4 and 6.

(ii) (a) Outcomes of event of getting a number greater than 5 is 6.

(b) Outcomes of event of not getting a number greater than 5 are 1, 2, 3, 4 and 5.

13. Find the.

(a) Probability of the pointer stopping on D in (Question 11-(a)).

(b) Probability of getting an ace from a well shuffled deck of 52 playing cards.

(c) Probability of getting a red apple. (See figure below)

Solution:

(a) In a spinning wheel, there are five pointers A, A, B, C, D. So there are five

outcomes. Pointer stops at D which is one outcome.

So the probability of the pointer stopping on D = 1/5

(b) There are 4 aces in a deck of 52 playing cards. So there are four events of getting an ace.

So, probability of getting an ace = 4/52 = 1/13

(c) Total number of apples = 7

Number of red apples = 4

Probability of getting red apple = 4/7

14. Numbers 1 to 10 are written on ten separate slips (one number on one slip), kept in a box and mixed well. One slip is chosen from the box without looking into it. What is the probability of .

(i) getting a number 6?

(ii) getting a number less than 6?

(iii) getting a number greater than 6?

(iv) getting a 1-digit number?

Solution:

(i) Outcome of getting a number 6 from ten separate slips is one.

∴ probability of getting a number 6 = 1/10

(ii) Numbers less than 6 are 1, 2, 3, 4 and 5 which are five. So there are 5 outcomes.

∴ probability of getting a number less 6 = 5/10 = 1/2

(iii) Number greater than 6 out of ten that are 7, 8, 9, 10. So there are 4 possible outcomes.

∴ probability of getting a number greater than 6 = 4/10 = 2/5

(iv) One digit numbers are 1, 2, 3, 4, 5, 6, 7, 8, 9 out of ten.

∴ probability of getting a 1-digit number = 9/10

15. If you have a spinning wheel with 3 green sectors, 1 blue sector and 1 red sector, what is the probability of getting a green sector? What is the probability of getting a non-blue sector?

Solution:

A total of five sectors are present.

Out of the five sectors, three sectors are green.

∴ probability of getting a green sector = 3/5

Out of the five sectors, one sector is blue. Hence, Non-blue sectors = 5 – 1 = 4 sectors

∴ probability of getting a non-blue sector = 4/5

16. Find the probabilities of the events given in Question 12.

Solution:

When a die is thrown, there are total six outcomes, i.e., 1, 2, 3, 4, 5 and 6.

(i)

(a) 2, 3, 5 are the prime numbers. So there are 3 outcomes out of 6.

∴ probability of getting a prime number = 3/6 = 1/2

(b) 1, 4, 6 are not the prime numbers. So there are 3 outcomes out of 6.

∴ probability of getting a prime number = 3/6 = 1/2

(ii)

(a) Only 6 is greater than 5.

So there is one outcome out of 6.

∴ probability of getting a number greater than 5 = 1/6

(b) Numbers not greater than 5 are 1, 2, 3, 4 and 5. So there are 5 outcomes out of 6.

∴ probability of not getting a number greater than 5 = 5/6

Welcome to Sarthaks eConnect: A unique platform where students can interact with teachers/experts/students to get solutions to their queries. Students (upto class 10+2) preparing for All Government Exams, CBSE Board Exam, ICSE Board Exam, State Board Exam, JEE (Mains+Advance) and NEET can ask questions from any subject and get quick answers by subject teachers/ experts/mentors/students.

Categories

...