Use app×
Join Bloom Tuition
One on One Online Tuition
JEE MAIN 2025 Foundation Course
NEET 2025 Foundation Course
CLASS 12 FOUNDATION COURSE
CLASS 10 FOUNDATION COURSE
CLASS 9 FOUNDATION COURSE
CLASS 8 FOUNDATION COURSE
0 votes
63 views
in Physics by (70 points)
edited by

3. Figure shows P-T diagram for a given mass of an ideal gas for the process A→ B. During this process, density of the gas is
(1) Decreasing
(2) Increasing
(3) Constant
(4) First decreasing then increasing

4. Figure shows P-V diagram for a given mass of an ideal gas for the process 1→2. During this process temperature of the gas

(1) Decreases continuously
(2) Increases continuously
(4) First increases then decreases
(3) First decreases then increases

Please log in or register to answer this question.

1 Answer

+2 votes
by (47.6k points)
edited by

3. (3) Constant

Given, 

P-T diagram

Density of gas will be constant as from graph pressure is directly proportional to the temperature

For ideal gas PV = nRT

From this relation V is constant

\(Density = \frac {mass}{volume}\)

As mass and volume both are constant so it's density will also constant.

4. (2) Increases continuously
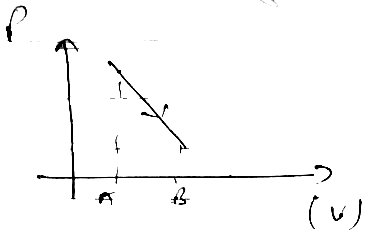
Figure shows P-V diagram for a given mass of an ideal gas for the process

PV = nRT

P/V = const = K

P = KV

⇒ (KV)V = nRT

⇒ V2 = CT

VA < VB

TA < TB

Increases

Welcome to Sarthaks eConnect: A unique platform where students can interact with teachers/experts/students to get solutions to their queries. Students (upto class 10+2) preparing for All Government Exams, CBSE Board Exam, ICSE Board Exam, State Board Exam, JEE (Mains+Advance) and NEET can ask questions from any subject and get quick answers by subject teachers/ experts/mentors/students.

Categories

...